Search our Knowledge Base
Search

Marketing Dashboard Settings


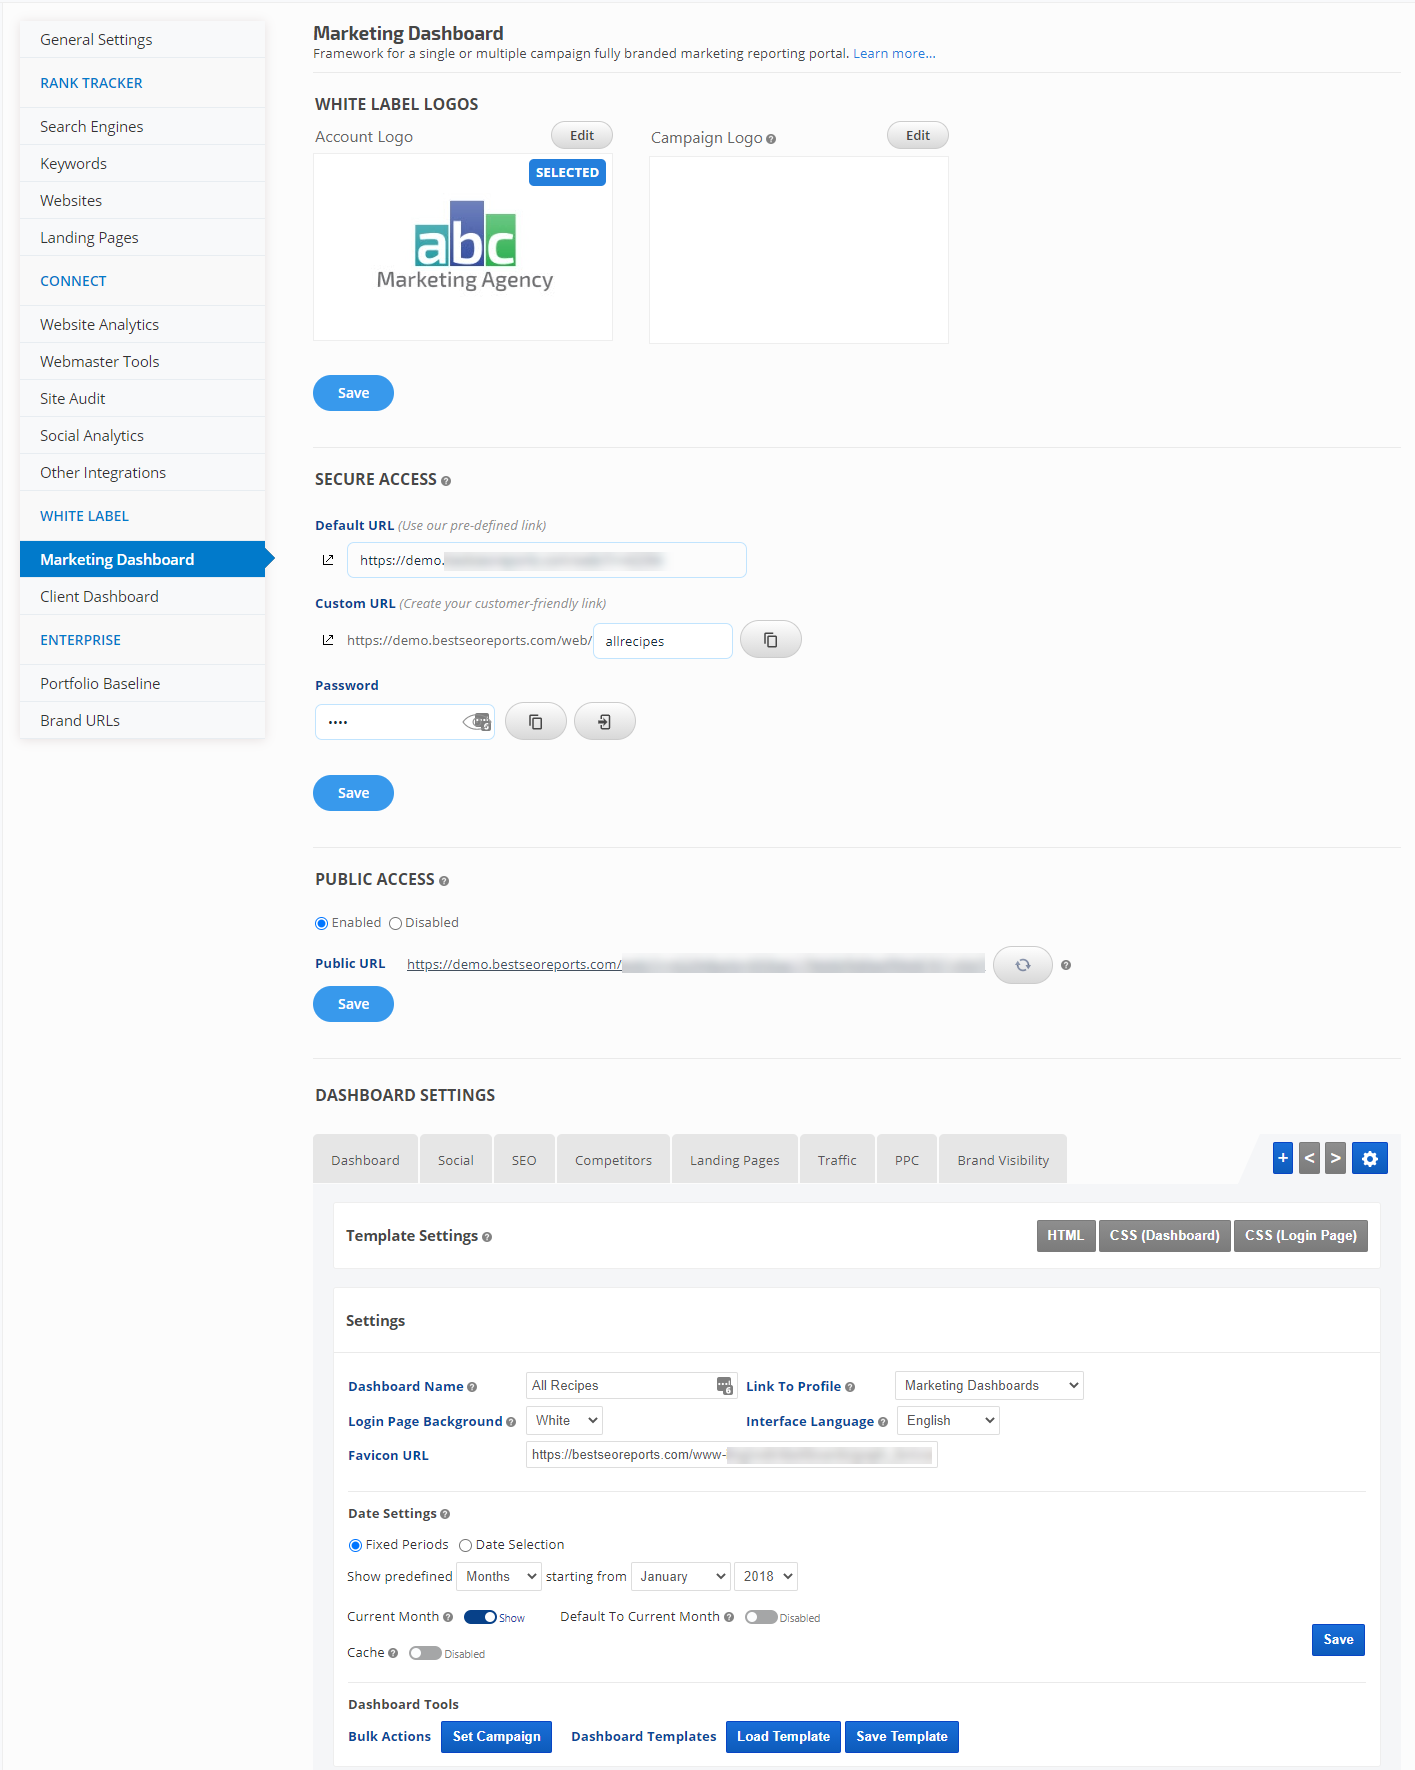
The Marketing Dashboard is a framework for a fully-branded, single or multiple-campaign marketing reporting portal that can be shared with clients or used for internal interactive reporting. You may begin with a blank palette giving you the freedom to design your client's marketing reporting experience, but you also have the option to: The examples in the screenshots on this page provide a few of the possible Marketing Dashboard styles, layouts, and configurations you might choose to showcase your professional services to your clients, please refer to our Marketing Dashboard Templates documentation for a variety of pre-built designs and report options.

IMPORTANT! When making any changes to dashboard settings, you must click the Save button in order for the new settings to be implemented.

web dashboard example
 

Marketing Dashboard Examples

 
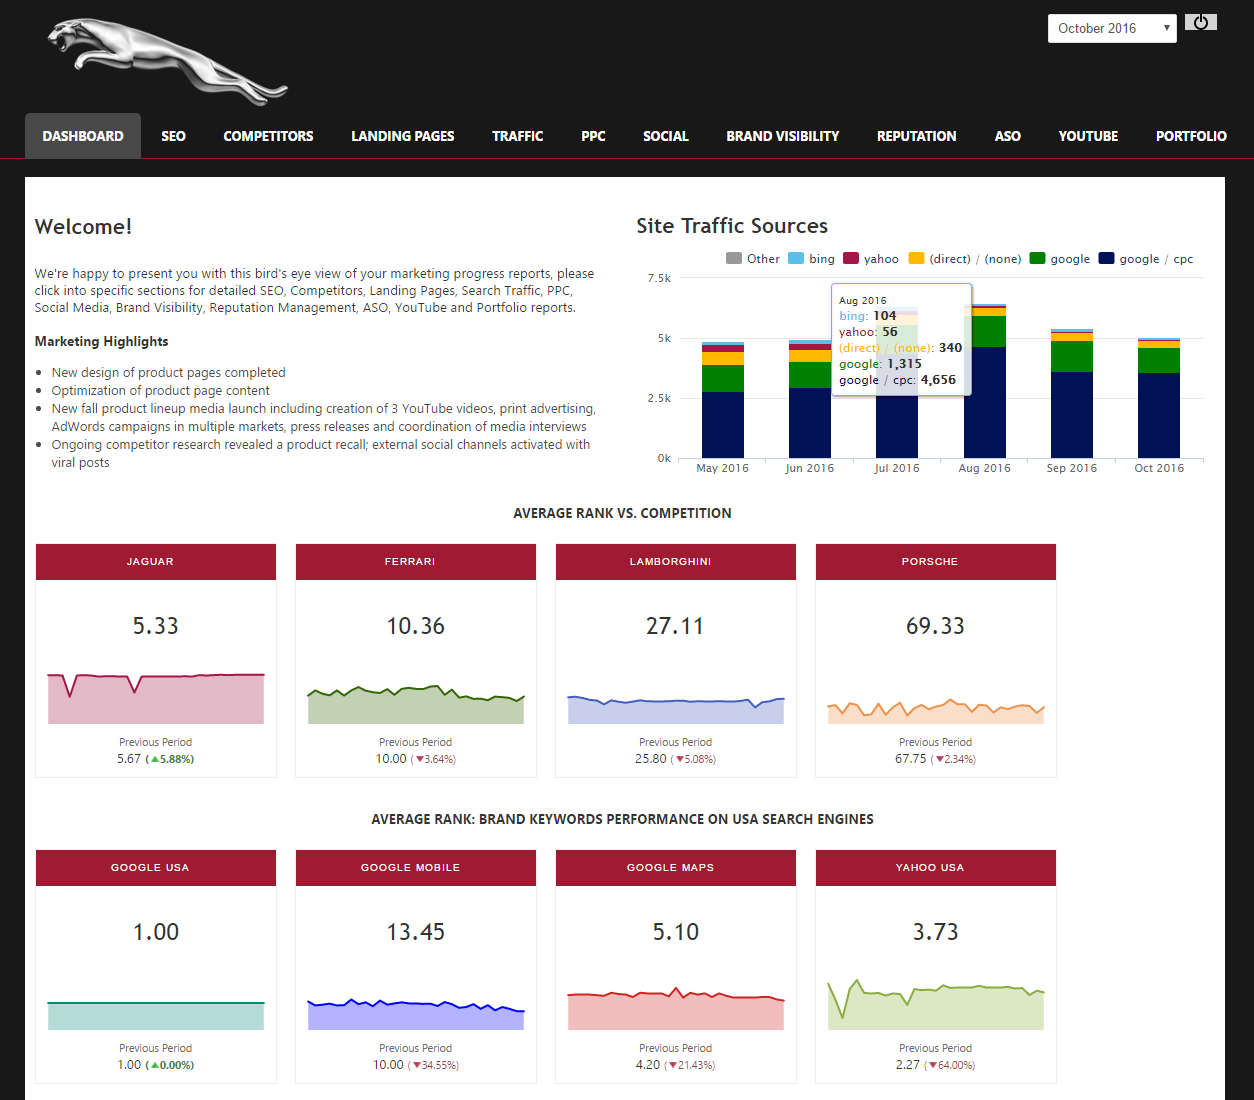
Example: Marketing Dashboard Customized with HTML & CSS to Match Branding
In this example, the HTML and CSS code have been modified to match the client's website design.  The Welcome message is created with a Text Box at 50% size leaving room for the Google Analytics Stacked Columns Widget to display beside it.  Multiple Single Metric Widgets were added to provide a colorful visual of average rank vs. competitors and average rank for brand keywords. Additional Text boxes and reports display below the widgets and on the other pages accessed via the top navigation menu of this marketing dashboard.

custom html and css dashboard


Platform Template Samples
Learn how to access and install one of these templates 


Report Template Samples
Learn how to download and install a report template


Are Marketing Dashboard Mobile Responsive?


Yes, Marketing Dashboards are responsive in design and can be used on mobile devices in addition to desktop.  Our dashboard has been tested on mobile devices in landscape mode using a Chrome browser including 7" tablets (e.g., iPad mini and Nexus 7), and even on cell phones as small as a Galaxy 5 (640 x 360 pixels), and iPhone 5 (568 x 320 pixels), with all functionality working fine (including the single sign-on feature).

You can select one of our templates or build your own utilizing a wide variety of widgets and reports, and HTML and CSS settings.  


Access Marketing Dashboard Settings


There are two ways to access your Marketing Dashboard settings:
  • Campaign Settings > Marketing Dashboard
  • White Label > Dashboards

Campaign Settings > Marketing Dashboard
  • On the home screen or inside any report, click the gear icon for the campaign and select Campaign Settings.
  • In the left sidebar select Marketing Dashboard
            
access Web Dashboard settings


White Label > Dashboards
  • In the top navigation menu hover over White Label and click on Dashboards
  • In the Marketing Dashboard section Settings column, click the settings icon (gear) corresponding to the campaign for which you want to create or edit a marketing dashboard.  

White Label Dashboards

Logos: Add or Change


By default, the White Label Account Logo is set to display in Marketing Dashboards.  You have the option to display a Campaign Logo or both.


Add Campaign Logo

1. Click the Edit button
2. Click the Browse button, navigate to and select the logo file on your computer (in most templates, the image file resolution will be set to 150 px high x 250 px wide, if your logo is a different ratio you may need to adjust the Dashboard CSS)
3. Click the Upload button
4. Click the OK button

add campaign logo


Resize and Save Campaign Logo (Optional)
  • After the file has uploaded, you can resize it by dragging the slider to your desired size
  • Click the Resize button
  • Click the OK button

resize and save logo


You should see the new Campaign Logo displayed in the White Label Logo section (depending upon your browser cache settings, you may need to refresh your browser). 

successful addition of campaign logo


Scroll down to the Dashboard Settings > HTML section and place the cursor between the logo div tags, and delete "Logo".  

Example of the HTML before changing Logo
 
change marketing dashboard logo


With the cursor still between the logo div tags, click the Campaign Logo button to set it to display in the dashboard. 

Example of HTML after adding Campaign Logo
 
add Campaign Logo


If you want both logos to display in the dashboard, refer to the section titled HTML & CSS: Display 2 Logos.

Share Dashboards: Secure vs Public Access


There are two ways to share marketing dashboards:
  • Secure Access requiring the viewer to log in
  • Public Access allows anyone with the link to view the dashboard (this is often used by companies that embed the dashboard into their web application

Secure Access to Marketing Dashboard
If you want your clients to access the marketing dashboard you've created in a secure manner with URL and password, then set up the Secure Access option.
  • The Default URL contains your Rank Ranger account username as a sub-domain followed by a report number.
  • The Custom URL also contains your Rank Ranger account username as a sub-domain, but allows you to define a customer-friendly sub-directory name (e.g., your client's company name, the ID for the customer in your system, etc.). In the following screenshot, the account username is example and the sub-directory name is adt.
    If you prefer to use your own domain (e.g., reports.yourdomain.com), refer to our Custom Domain service.

Share secure access to marketing dashboard

  • For Custom URL, enter the name, word or numbers in the sub-directory field
  • Enter a Password
  • Click the Save button
  • Share the URL and password with your client

Public Access to Marketing Dashboard
With Public Access users can access your Marketing Dashboard without a username or password.

One use case for this feature is if you display our marketing dashboard inside your software or website and you want the ability to turn access on and off (e.g., customer stops paying for service), the Public Access URL can easily be disabled and enabled (and reset to a different URL). In addition to the Marketing Dashboard settings screen, the Public Access URL can be controlled via API, refer to White Label Marketing Dashboard Public Access API for additional information.

share public access to marketing dashboard

Custom Domain Service


Use Your Domain
With our Custom Domain Service, you can use your own domain instead of our white label reports domain (learn more). Once you've set up your custom domain service, the URL you entered in Account Settings displays in the Secure Access Custom URL field. In this example, reports is a sub-domain of yoursite.com, however, it is also possible to set this up for the root domain if the domain will serve exclusively as your white label marketing reports platform.

Use your domain for white label reports


Marketing Dashboard Login with Custom Domain example
If you were the owner of this site and you subscribed to custom domain service using a sub-domain named reports, and ADT was your customer, then the URL that you would provide your customer could look similar to this:
http://reports.yourdomain.com/adt

The log in screen can display either your account logo or the campaign logo (in this case the account logo is displayed)

marketing dashboard secure custom domain login

Custom Domain Marketing Dashboard example
Once the user logs in, the URL remains your domain followed by a dashboard sub-directory and the user sees their logo (or yours or both depending upon the style you choose), and the reports you've set up for them.
           
Custom domain marketing dashboard example 

Settings: Dashboard Name


The Marketing Dashboard Name displays as the title in the browser tab and you can control what displays with this setting.

Marketing Dashboard Name

Web Dashboard Name


Name your Dashboard
In the Dashboard Name field, enter your company name, client's company name, a generic name (e.g.,  Dashboard) or descriptive name (e.g., Marketing Dashboard, SEO Dashboard, Social Analytics Reports, etc.). 

add Web Dashboard name


Click the Save button.

Settings: Single Sign-on


How to add the Single Sign-on Feature to a Marketing Dashboard


Multiple Campaigns in One Marketing Dashboard with Single Sign-On
The Link To Profile can be used to group multiple campaigns into one Marketing Dashboard. For example, if you have 4 campaigns for 1 client (organic, local, YouTube and App Store Tracking, or multiple location-based campaigns) you can assign a Profile in the General Settings > Advanced Settings screen and then select that Profile in the Marketing Dashboard settings of the campaign that will be used to launch the dashboard.

multiple campaigns single sign-on


Campaign Profile
In Campaign Settings > General Settings, expand the Advanced Settings section and select (or Add) a Profile that is common to the campaigns that you want displayed in one Marketing Dashboard. Click the Save button. 

General Settings Campaign Profile


Marketing Dashboard Link To Profile
In Campaign Settings > Marketing Dashboard (for the campaign that will be used to launch the marketing dashboard), select the Link To Profile that is common to all the campaigns that you want displayed in one Marketing Dashboard. 

Single Sign-on Dashboard with profiles
Click the Save button.


Create a Style for the Profile Menu
Click the CSS Template Settings button and add a style for the profile menu, for example:


add profile to CSS

Click the Save button.


Add Linked Campaigns to the HTML
Click the HTML Template Settings button, add the CSS class that you created in the previous step, click between the div class open and closing tags and click the Linked Campaigns option.

add profile to HTML

Click the Save button.

Single Sign-on Marketing Dashboard example

example of web dashboard with single sign-on

Settings: Login Screen Default Options


If you're using Secure Access for sharing marketing dashboards, you have two options for the style of the login screen:
  • Default settings (a built in style, or choice of solid white or gray)
  • Custom CSS (for instructions, please refer Design: CSS Login Screen)


Login Screen Background Color Options

If using the Secure Access option, you may choose from default, gray or white login screen backgrounds.

Login Screen Background options

Login Screen Background Settings
The Default background displays unless you select another option in the Login Page Background settings.

Web Dashboard login screen background


If you make changes, click the Save button. 

To customize the login screen with a background image or other formatting, refer to the Dashboard Template Settings > CSS (Log in Page) instructions.

Settings: Interface Language


Interface Language
The Interface Language affects the report content. Select the desired language.

set web dashboard interface language

Click the Save button.


Marketing Dashboard Language Example (Swedish)

web dashboard interface language set to Swedish

Settings: How to Add a Favicon


Favicons or tab icons display beside the dashboard name in the browser tab and provide an additional white label opportunity for branding your dashboards.  

favicon example


Add a Favicon 
You can add a favicon to a marketing dashboard if you have a self-hosted image file.
  • Enter the URL in the Favicon URL field of the Dashboard Setttings section
  • Click the Save button

add favicon url


Settings: Date & Cache


Marketing Dashboards offer 2 date options: Date Selection or Fixed Periods.

Date Selection 
The Date Selection setting enables a calendar function in the Marketing Dashboard that allows the viewer to select specific report date(s).      
     
Dashboard date selection option

To enable this option, select Date Selection and click the Save button.

Dashboard Date Settings


Fixed Periods
The Fixed Periods setting allows you to restrict the date selection to Months, Quarters or Years. 

Dashboard fixed date periods

To enable this option select the Fixed Periods option and select predefined Months, Quarters or Years and the starting from period (Month and Year) and click the Save button.

select date settings
 
Current Month
To list the current incomplete month in the dropdown menu in the frontend of the marketing dashboard simply switch the Current Month toggle ON. The data of the previous complete month will display by default in the Marketing Dashboard, however there will be an option to choose from the dropdown the current incomplete month. For example, on January 20th, 2021 the Marketing Dashboard will display the data for December 2020 (because it's the last complete month) with an option to choose January 2021 in the Report Date dropdown.

The Default to Current Month toggle will become available when Current Month toggle is ON. Turning this option on will display the current incomplete month by default on the Marketing Dashboard (eg. January 2021 on January 20th, 2021).

Dashboard Cache
Caching is available for the Fixed Periods Date Setting only. When enabled, report options, graph settings, and monthly data is cached to increase the load speed of dashboard pages.  By default Cache is disabled, to utilize this feature:
  • The My Account Platform Default Settings must have Report Data Caching set to Enabled.
  • In the marketing dashboard settings, switch Cache to the Enabled setting and click the Save button.


Pages: Add


Pages are used for adding content to your dashboard. You may create a one-page dashboard or add multiple pages to organize the presentation of your reports and graphs. The names that you define your pages with determine the names that display in the navigation menu. Page features include elements:
  • Elements are reports, graphs, text boxes, or notes. 
  • Elements can be sized to 50% width, or if you are experienced with CSS you may code them to different sizes.  
  • Elements can be duplicated and dragged into a position on the same page or a different page.
  • Text boxes can contain formatted text, images, embedded videos and other iframe content.

Pages can also be duplicated, and offer an External URL option that can be used to launch a page on a different site.


Add Pages (menu tabs)
Reports, Graphs and Text Boxes can be organized on separate pages that display like menu tabs across the top of a Marketing Dashboard.
  1. Click the + button to add a page
  2. Enter a Page Name
  3. Accept the default Page URL or change the name, or if you want the tab to lead the user to webpage outside of the Marketing Dashboard, select External URL and enter the full URL
  4. Click the Save button

add a web dashboard page


Pages: Settings

Page Settings is available for each page and the button could be found when one of the existing tabs is clicked


The available options in the Page Settings are:
  • Page Name
    Just click into the Page Name field and enter the desired new name
  • Page URL or External URL (optional)
    Only alphabetic and arithmetic characters are accepted with no spaces in between.
    For the External URL once the radio button is selected and the URL has been entered the tab in the Marketing Dashboard front end will open as a new browser tab with the given URL.
  • Save to history 
    Clicking on the Save to history will save a revision of the page. Very much recommended to save in order to be able to recover in case something got deleted by mistake.
  • Loade from history
    If the Save to history was performed then the Load from history will display all available revisions, which can be recovered once the desired revision is clicked.

Pages: Add Reports & Graphs


Reports and Graphs can be added to Marketing Dashboard Pages in the Campaign Settings > Marketing Dashboard screen or directly from individual reporting screens if you have added at least one page to the dashboard.

Add Report in Campaign Settings > Marketing Dashboard
  • Click the Add Report button
  • Select the Campaign and Report name
  • Select the desired report or graph metric options
  • Click the Save button
You can continue to add more reports, graphs and text boxes to the page.

add report to web dashboard page


Add Report or Graph from individual reporting screen
After adjusting the report or graph options and confirming it displays as you want it to in the Marketing Dashboard, you can hover over the gear icon and click Add to Marketing Dashboard. A selection box displays for you to select the Marketing Dashboard and Page you want the report added to.

IMPORTANT: When adding an Insight Graph or Metric Widgets from the user interface, the data for the specific campaign is locked and the campaign cannot be changed in the Marketing Dashboard.  The main benefit of this feature is to allow for one dashboard to contain data from multiple campaigns. 

If you wish to create a graph or set of widgets and apply them to multiple dashboards, we recommend:
  • Save the graph or widget as an Account Wide Preset so it can be applied to each campaign individually and then added to a Marketing Dashboard or...
  • Create the graph in one of the dashboard's settings and save that dashboard as a template to be applied to the other campaigns.


Add Report directly to web dashboard


After you've clicked the Marketing Dashboard Page name, a success confirmation message displays and contains a link that launches the Marketing Dashboard settings screen where you can make further changes (e.g., add a text box explaining the report, change the report display order or width, etc.)

report successfully added to web dashboard

Pages: Size Page Elements


Page elements have a drag and drop feature and can also be sized to 1/2 or full screen width. Simply click the size icon to change from full to half width, and drag and drop into the desired position.

adjust page layout

Pages: Duplicate


Duplicate Page containing Reports, Graphs and/or Text Boxes
  • While on the dashboard page that you want to copy, click the Duplicate button and a new page will be created in the last (far right) position.
  • Click the new page's tab and then Page Settings to change the page name.
You can also make changes to the report or graph settings on the new page. For example, if you have created a Local SEO report page for your client's Dallas, TX location, you can duplicate that report page for their Houston, TX location and select the Houston keyword tags, search engine setting or a separate campaign you created for that local rank tracking.

duplicate dashboard pages

Pages: Duplicate Page Elements


Duplicate Reports, Graphs & Text Boxes
When you create graphs or reports and want to duplicate one with a few changes (e.g., traffic graph for desktop and a similar one for mobile), simply:
  • Click the element's Duplicate icon and a copy will be created
  • Edit the report options as needed
  • Click the Save button
Page elements can be duplicated and dragged to various positions on the page, or to other pages in the dashboard where they can be positioned as needed.

duplicate page elements


Pages: Add Text Boxes


Text boxes can be inserted to add formatted text, images, embedded videos and other iframe content to your marketing dashboard. 


Add Page Element
To add a Text Box, simply click the Add Text Box button.
  • If you want a title to display on the page above the text, enter it in the Title field and set that element to Show.
  • If the content should always be displayed, then confirm that the content period is set to Always.
Enter the content in the editor and click the Save button.


Define Content Display Period
If you have content that you want displayed only for a specific period of time, select the Specific Time Period option and define the dates during which the text box content should display.

text box date settings


Setting a Custom Date Range

You can set a custom date range during which time the text you enter will display in the marketing dashboard. For example, if the text you want to share in the dashboard should only be displayed during the month of December, then follow these steps and select December.
  • Select the Specific Time Period option
  • Select the Date range
  • Click the Add Period button
  • Enter content in the text box
  • Confirm that the Content for Period has the correct period selected (if not, then select it)
  • Click the Save button

set a custom date range during which text will display


Content Editor
The Text Box WYSIWYG editor allows for insertion of videos, images, links, tables and customization of the source code and font styles and colors. Click the Save button when editing has been completed.

text box content options


Pages: Link to Internal & External Pages


Clients must log into a dashboard in order to access any of its pages, and the login screen will always open the first page of that Marketing Dashboard. If you want to change the order of the page display, so that your client sees a different page first, you can drag the page order in the Campaign Settings > Marketing Dashboard screen.

Link to Pages inside the Marketing Dashboard
It is possible to link to a specific page in a Marketing Dashboard from another page in that dashboard provided the client is logged into the dashboard. For example, if you create a Text Box on the first page, you might want to link some of the text to specific pages inside the marketing dashboard.

To create such a link, click on the page that you want to link to and copy the URL. For example, the link for a Brand Visibility page might look like this:
http://example.bestseoreports.com/dashboard/brand?date_period=08_01_2019-08_31_2019 

That will take the user directly to the Brand Visibilty page for the month of August 2019. If you want the link to open the report without forcing the date parameter, then you should remove the date parameter:
http://example.bestseoreports.com/dashboard/brand


Create and Link to an Anchor on a Dashboard page
It is possible to add HTML code to a text box for the purpose of creating an anchor on the page. So if, for example, on the Traffic page you want to create a link to a Social Traffic graph half-way down the page:
  • Add a Text Box and drag it above the report you want to create the link for
  • Edit the Text Box, click the Tools > Source code option

  • add text box and edit source code


  • Enter anchor text code as in this example

    add anchor text to web dashboard

  • Click the OK button
  • Click the Save button
  • Obtain the page link and add the #sign followed by the anchor text (e.g., #social) to the end of the URL (replacing "social" with the word you used)
    Example: http://example.bestseoreports.com/dashboard/traffic#social 
  • Insert the link in a different text box in the marketing dashboard using the content editor tool

Link to External Pages
If you want a page to lead the client to a web page outside of the dashboard:
  • Click the Page Settings button (or the + symbol to Add a New Page)
  • Select the External URL option
  • Enter the full URL
  • Click the Save button


Pages: Embed Videos


Vimeo and YouTube videos can be embedded into a Marketing Dashboard page with a few easy steps.


Step 1: Obtain the Embed Code


Embed YouTube Video
  • While on the YouTube video screen, click the Share link below the video
  • Click the Embed option.
  • Copy the iframe link code that displays next to the preview
embed YouTube video in Marketing Dashboard


Embed Vimeo Video
  • While on the video screen, click the Share in the top right corner of the video
  • Copy the Embed link.
Instructions for obtaining embed code may change as Vimeo updates their platform, in which case we suggest that you refer to this Vimeo Help Center article for additional instructions.

embed a Vimeo video in marketing dashboard


Step 2: Add Embed Code to a Marketing Dashboard Text Box


  • Click the dashboard Page that you want to add the video to and then click the Add Text Box button.
  • Click the Insert > Media option
     
    embed video

  • Click the Embed tab and paste the embed code into the field, click the OK button.
     
    insert video embed code

  • Enter text or delete "Text here..." and click the Save button.
     
    add video description

Pages: Embed Data Studio Report


By following Google's instructions, you can obtain iframe embed code for the reports you've created in Data Studio for white label reporting in our Marketing Dashboard.

Once you have that iframe embed code, you can embed the report into a Marketing Dashboard Text Box.
  • Add the Text Box
  • Click Tools > Source code
  • Paste the embed code into the empty field and click the OK button.
  • Click the Text Box Save button.


Google Data Studio Report Embedded in a Marketing Dashboard


Data Studio report embedded in Rank Ranger marketing dashboard

Rank Ranger Graphs & Widgets
With a Google Analytics integration, the type of data that's in the above Data Studio example (and so much more) is also available in Rank Ranger reports and graphs.  In this example, we've displayed the Sessions source data using the Pie/List Widget (we hid the pie chart, you can also hide the % column and total row, and change the number of rows displayed). Next we added an Insight Graph displaying the Session data trending over 4 months compared to the same time last year. This view is possible by setting both elements to half screen width.

Rank Ranger traffic graphs

Pages: Embed Google Sheets, Forms and more


Obtain Google Embed Code
Please refer to Google's Embed Files documentation for the most current way to obtain the embed code for the type of file you want to embed in our dashboard.


Add Embed Code to a Marketing Dashboard Text Box
  • Click the dashboard Page that you want to add the file to and then click the Add Text Box button
  • Click the Tools > Source Code  option
     
    embed Google files
     
  • Paste the embed code into the Source Code field.
  • Click the OK button.
     
    insert Google file embed code
     
  • The file previews on the screen. If the sheet width or height don't appear as you expect, then click the Tools > Source Code option again and add parameters to the iframe code between the " and >, for example, headers=false" width="800" height="600"> 
  • Click the Save button.
     
    save text box with Google embed code

Pages: Delete Page or Page Element


Clicking the Remove button or icon permanently deletes the item, there is no recovery.

  • If you want to permanently remove a page (i.e., a marketing dashboard page has a navigation tab and contains page elements), then click the Remove button 
  • If you want to remove an element (e.g., a report, graph, text box, etc.), then click the X at the far right of that element

remove marketing dashboard page or element

Display Notes Report in Marketing Dashboards

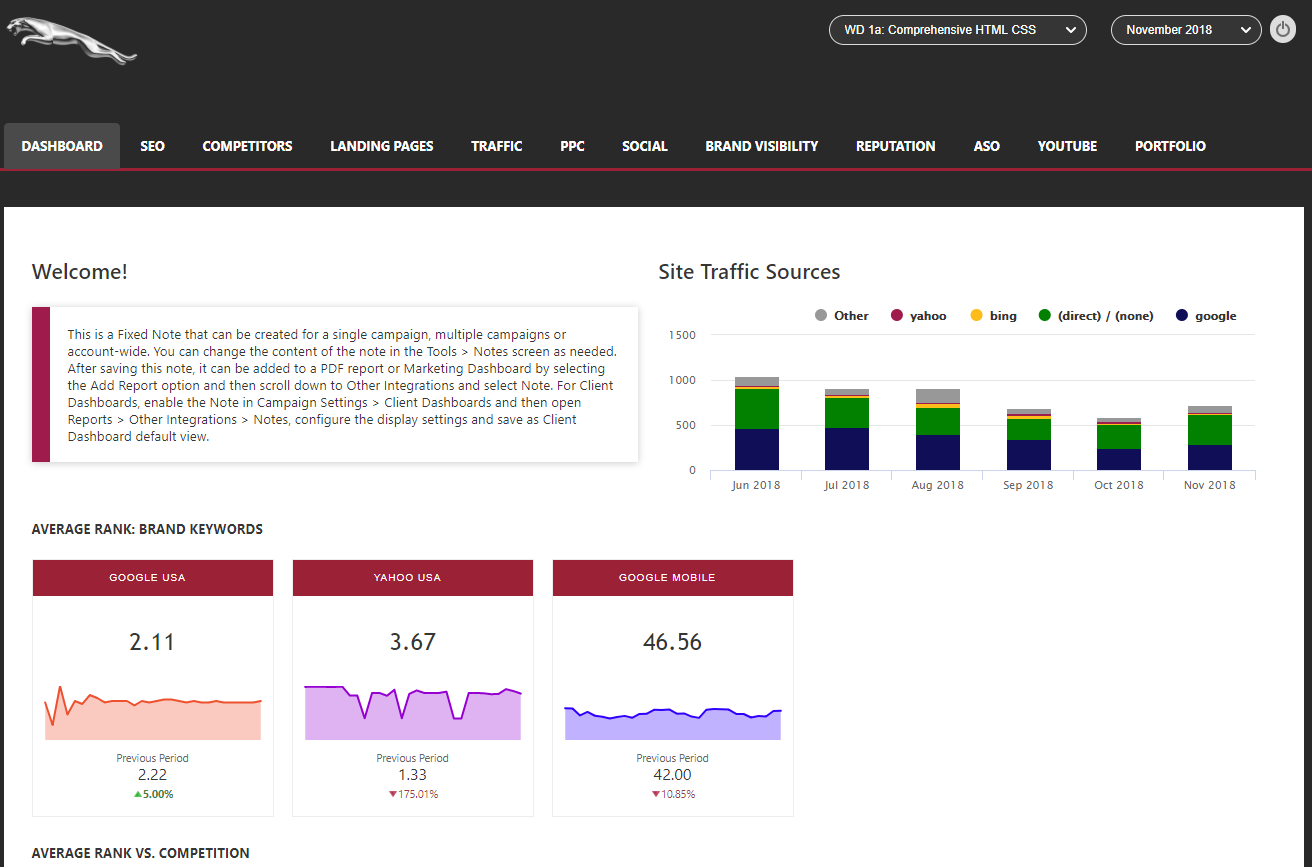
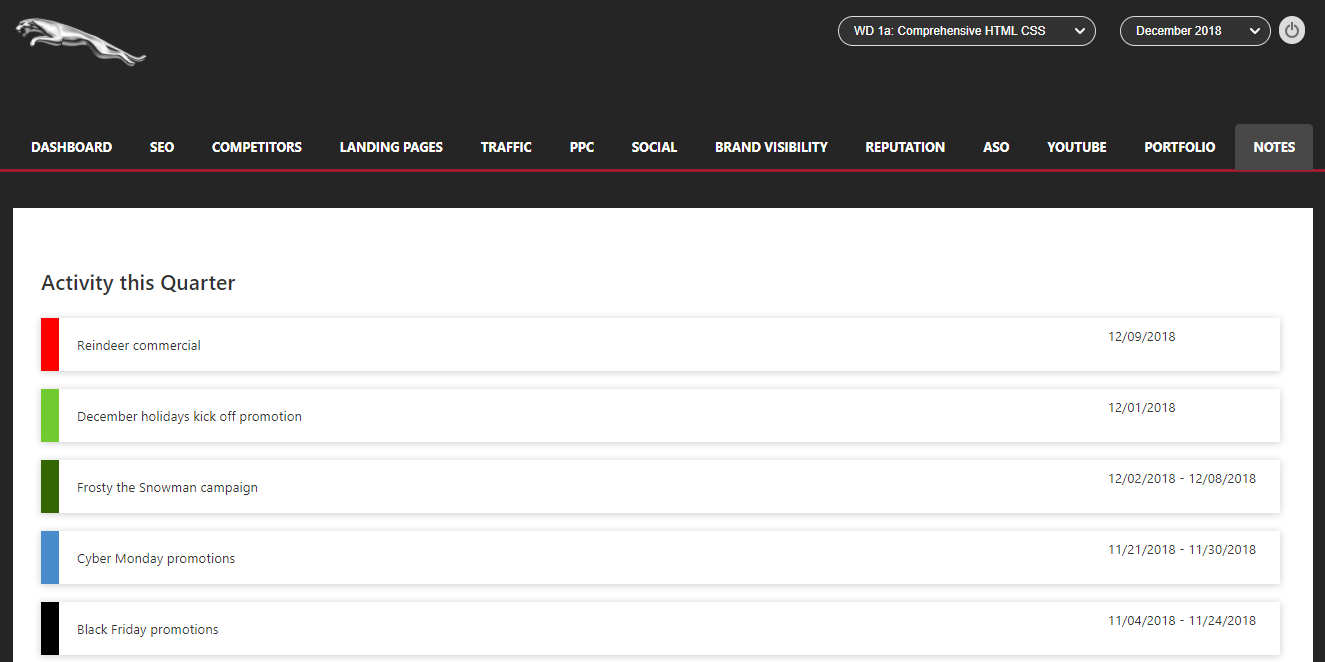
There are 3 types of Notes that can be displayed in Marketing Dashboards, Single Date and Date Range display text in a marketing dashboard based on the report date setting. Fixed notes can be used to display a message for a single campaign, specific multiple campaigns or account-wide continuously and the content can be changed as needed (in the Campaigns > Toolkit > Notes screen).

Fixed Note displayed in Marketing Dashboard

Fixed Note in Marketing Dashboard


Single Date and Date Range Notes in Marketing Dashboard

dated notes in marketing dashboard


Add Note to Marketing Dashboard
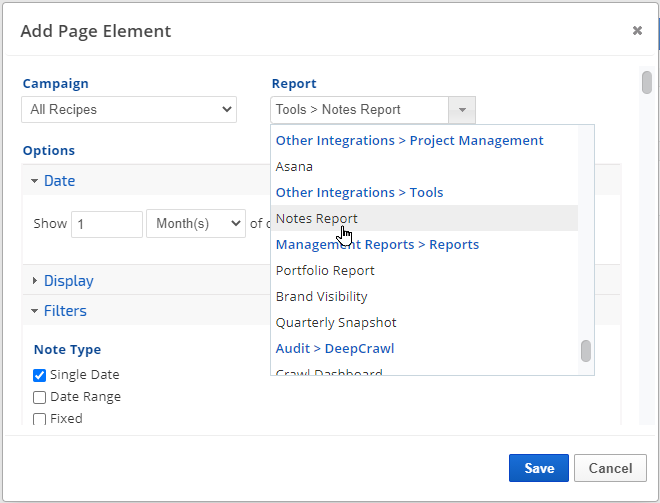
After creating a Note (in the Campaigns > Toolkit > Notes screen), click the Add Report button on the marketing dashboard page that you want notes to display on and scroll down to Other Integrations > Tools and select Notes Report 

add note to marketing dashboard


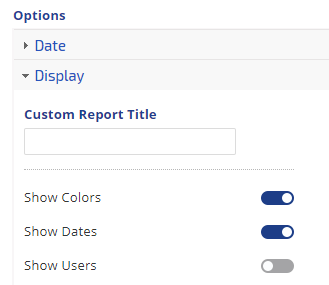
Display Settings
Select the options that you want displayed:
  • Custom Report Title (optional): enter text that you want displayed at the top of the Notes list
  • Show Colors: if selected, then a color border will display to the left of the note
  • Show Dates: if dates are associated with the note and you want that displayed, then enable this option
  • Show Users: if you want the name of the person who created the note to be displayed, then enable this option

display settings


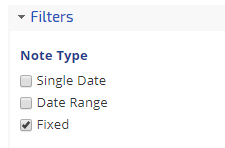
Filters
Select the Type of Note(s) you want displayed in the dashboard 
  • Single Date displays text for a single date on a graph hover or in reports that support this feature
  • Date Range displays text across a date range on a graph or in reports that support this feature
  • Fixed can be used to display a message for a single campaign, specific multiple campaigns or account-wide continuously. This note type is not limited to specific date(s), it can be set to display in white label marketing dashboards, client dashboards and PDF reports, and then the content can be changed as needed, in the Campaigns > Toolkit > Notes screen.
filters


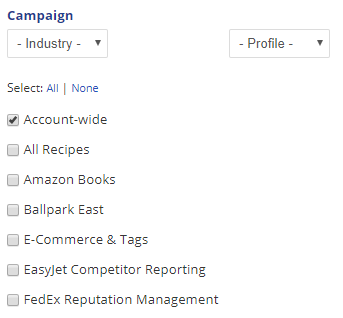
Campaigns
Select the Campaign(s) for which Notes were created that you want displayed in this dashboard (e.g., if this is a corporate dashboard that summarizes 10 branches of the company, you might select all of the campaigns that are associated with it). 

select campaigns


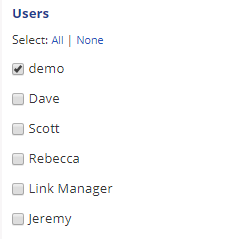
Users
Select the Users who created Notes that you want displayed in this dashboard

users

Click the Save button and drag the Notes element to the position you want it displayed in the dashboard.

Client Dashboards vs. Marketing Dashboards


All reporting platform plans are equipped with our original Client Dashboards.  This online dashboard mirrors the Rank Ranger Platform layout to the extent of the reports you choose to include, and permissions you establish for each client.

The Marketing Dashboard, originally a premium feature is now also included in reporting platform plans. It provides a website style framework that is customizable with access to HTML and CSS.  Additional features include a built-in dashboard navigation menu for web pages and external links, page elements that can be sized to 1/2 or full screen width for the report, graph, and text box layout flexibility, a WYSIWYG text editor for static or scheduled messages, and embedding of files and images, templates, and support for multiple versions of the same reports and graphs.

 Feature  Client Dashboard
 Marketing Dashboard
Design Mirrors the Rank Ranger platform based on the reports and permissions enabled for client view
Website style framework with fully customizable HTML and CSS. Page elements can be sized to 1/2 or full screen width for layout flexibility
White Label Logo
1: choice of your company logo or your client's logo
2: choice of one or both your company logo and client's logo
Client Access URL
Login credentials or public URL
Use your domain URL
Custom Domain, add-on option
Multiple campaign Single Sign-on
Yes, Profiles can be used to group multiple campaigns for viewing with a single login to a dashboard
Yes, Profiles can be used to group multiple campaigns for viewing with a single log in to a dashboard
Reports & Graphs
1 of each Rank Ranger report and graph
You can add multiple versions of the same report or graph, and organize them in web pages with titles displayed in the navigation menu.
Cross-campaign Reports & Graphs
No, each Client Dashboard presents report data for  the campaign it is associated with. However, single sign-on to multiple campaigns is possible.
Yes, Marketing Dashboards can contain data for any campaign in the account. For example, it is possible to create a dashboard with data from a campaign for a website, and separate campaigns for the YouTube and the App Store affiliated with the website.
Text boxes
Not available
Text boxes can be used to display messages to clients and can be scheduled to display during specific time periods or constantly. They can display before, after, or beside reports and graphs.
Embed External Data
Not available
Embed Images, Google Spreadsheets, Presentations, Drawings, and Forms as well as Vimeo and YouTube videos
Templates No, however, you can set an account level default for the reports and graphs you  want to be displayed in all Client Dashboards for new campaigns. Additionally,  Client Dashboard report default settings can be created for each report per campaign.

Yes, you can select from a variety of built-in design templates, launch one of our templates and edit it to fit your needs, or create and save your own design and content templates that can be applied to other campaigns.


Demo Dashboards


Client Dashboard example
Experience a live Client Dashboard  with multiple campaign single-sign on feature, that uses a Public URL access
(no password required)

Client Dashboard example

 
Marketing Dashboard example
Experience a live Marketing Dashboard demo with a single sign-on feature, that uses secure login access
(password: demo)
web marketing dashboard example


Marketing Dashboards are a premium feature that can be subscribed to in stand-alone marketing dashboard plans or added to full reporting platform plans. If your current plan does not support Marketing Dashboards and you would like to take advantage of this game-changing feature, please log into your account and complete the Build Your Own Scalable Package form at the bottom of the Add New Package screen and we'll be happy to provide you with pricing and build a custom plan that meets your current requirements and is expandable for future growth.

Get the ultimate SEO tools with the Rank Ranger Software
Learn More About Rank Ranger